Data processing of FORS2 data: Frequently asked questions
General:
- What is the best way to reduce FORS2 data?
Answer: We recommend to run the ESO pipeline with a Reflex workflow. Pipelines and tutorials how to reduce the data are available at http://www.eso.org/sci/software/pipelines/.
- I have downloaded some FORS2 data from the archive. Why are there multiple fits files with the same start-time?
Answer: The FORS2 CCD mosaic consists of two chips. The data of these chips is stored in individual fits files. Hence for each exposure, there are two FITS files with the same start time and date, corresponding to the data from chip1 and chip2.
- I activated the "Use CalSelector Associations" option in the DataOrganizer. Now I get an error even though the Datasets were marked as complete. Why?
Answer: This happens when the OCA rules to define the Datasets differ between Reflex and calSelector. We are currently working to homogenize the two tools and sets of rules. Until this has been achieved we recommend not to use this option in the DataOrganizer for the PMOS workflow.
Photometry:
- How can I find the photometric zero point for my FORS images?
Answer: If standard stars fields were observed during the same night you can find the nightly zeropoints (and extinction) at
http://archive.eso.org/qc1/qc1_cgi?action=qc1_browse_table&table=fors2_photometry.
The description of the table entries and definitions can be found at
http://www.eso.org/observing/dfo/quality/FORS2/qc/zeropoints/zeropoints.html.
Due to the method used, the nightly zeropoints become available with a delay of about 4 weeks.
• When I run the fors_zeropoint recipe, it gives me the warning that no star can be found because of missing WCS functionalities. Should I be concerned?
Answer: If you encounter this error, most likely the WCS library did not compile correctly during installation. This error is known to occur under certain operating systems. Please consult the pipeline release information for a full list of all supported operating systems.
Spectroscopy (LSS/MOS/MXU)
- Where can I find a line-list to use for the wavelength calibration of my data?
Answer: All static calibration files necessary to reduce FORS2 data are included in the calibration directory. In Reflex, these are located in install_dir/calib/fors-versionnumber/cal folder. The directory is also included in the FORS2 pipeline release file (available for download from http://www.eso.org/pipelines). The ACAT files are fits tables which contain the master line catalogs. Which of these files to use depends on the grism and order blocking filter used in your observation. This information can be extracted from the header of the fits file of the science data: The grism information is stored in HIERARCH ESO INS GRIS1 NAME and HIERARCH ESO INS GRIS1 ID, the filter information in HIERARCH ESO INS FILT1 NAME (exists only if a filter was used).
- My reduced spectra do not cover the wavelength range I expected - why?
Answer: Some grisms (e.g., GRIS_300V) are subject to second order contamination unless they are used with an order separation filter (e.g., GG435). The pipeline will limit the wavelength range of the reduced spectra to the range not affected by the overlap if the filter was not used. The user can change the wavelength range in the interactive window of the fors_calib actor, by editing the startwavelength and/or endwavelength values of the file classified as GRISM_TABLE, or by specifying these parameters on the command line.
- Why do I get the message that "no slits could be detected", even though in the raw frames I can clearly see the slits?
Answer: This problem usually occurs if you try to reduce FORS2 observations taken before April 1, 2002. At that time a CCD with a different pixel size was used (25 micron instead of 15 micron). You will need to manually override the value for the dispersion [in Å/pixel] from this table by specifying the --dispersion parameter in the fors_calib recipe. The value for the old CCD is 5/3 of the one in the GRISM_TABLE.
- In order to observe the range 4100-6800 Å with GRIS_600B+22, we have shifted the slit itself. A bright feature appears in the spectrum. What is it?
Answer: The bright feature is likely to be the spectral 0th order.
Polarimetry
- Why is the polarisation angle in my pipeline reduced data not as I expected?
Answer: The PMOS ESO pipeline user should be aware that when the position angle is not equal to zero the polarisation parameters U, Q and ANGLE, are not given with respect to the standard north-south direction, but with respect to the position angle on sky. Thus, to obtain the true object polarisation angle the user should apply the following transformation:
polarisation angle = pipeline polarisation angle - ADA.POSANG (position angle on sky)
This also changes Q and U, in the following way:
new_Q = original_Q * cos(2*rot) + original_U * sin(2*rot)
new_U = -original_Q * sin(2*rot) + original_U * cos(2 * rot)
with rot = - ADA.POSANG
This is seen when one reduces PMOS polarimetric standard star data with the FORS2 pipeline, e.g., in the case of the star Vela X-1:
For POSANG = 0, the following extracted values are obtained: ANGLE = 172.22 (in agreement with tabulated values for Vela X-1), Q = 0.077 and U = -0.021, while for POSANG = -30, ANGLE = 142.36, Q = 0.02, and U = -0.07.
Spectroscopy - Flux Calibration
- There is no flux standard star for my LSS observations - why?
Answer: calSelector delivers for LSS data only those flux standard stars that were observed at the same position on the detector as your long-slit spectrum to ensure the same wavelength coverage. In earlier times this rule was not followed strictly and sometimes the standard star was observed at the center of the field-of-view instead. You can look for observations at the instrument specific query forms for FORS2by setting the following constraints:
Start The date of your observations - 5 days
End The date of your observations + 5 days
DPR.CATG CALIB
INS.MODE MOS
INS.FILT1.NAME the order-separating filter of your observations (use Any if you had no filter)
INS.GRIS1.NAME The grism of your observations
and selecting for display in addition
DP.ID
OBS.TARG.NAME
DPR.TYPE to identify the standard star (STD) and its calibrations (FLAT,LAMP and WAVE,LAMP)
DET.CHIP1.ID to identify the correct chip for mosaic data
SEQ.SPEC.TARG position at which a MOS standard star has been taken
- Why do my flux-calibrated spectra not agree with independent photometric measurements?
Answer: In order to have a true absolute flux calibration, several requirements need to be fulfilled:
The fraction of the total flux of an object that is contained in the slit depends on the shape of the object, the width and orientation of the slit, and the seeing. Absolute flux calibration requires that all the flux of both the object and the standard star has been collected.
The flux that arrives at the telescope depends on the transparency of the sky. Absolute flux calibration requires the same transparency for the observations of the target and the standard star.
A change between the flux standard observation and the science object observations of any of the parameters mentioned above will change the flux scale in the final spectrum. To compare the flux calibrated spectrum to other measurements, differences in slit losses and atmospheric conditions have to be taken into account.
With respect to the faction of flux contained within the slit one should keep in mind that the flux standard stars are observed with a 5'' wide slit, while science data are typically observed with slit widths of 0.8'' to 1''. For a point source a slit width of 0.8''/1.0'' used with a seeing of 0.8'' means that some 33%/24%, respectively, of the target flux are lost. This results in a too low flux for the flux calibrated spectrum of the target.
If the standard star or the target or both are observed under non-photometric conditions (e.g. CLR or THN) their observed flux will be lower than it should be. If the standard star is observed under photometric conditions but the science target is not the flux in the flux calibrated target spectrum will be too low. The opposite happens if the target is observed under photometric conditions but the standard star is not. CLR/THN conditions allow for transparency variations of 10%/20%, respectively.
- In reducing some FORS2 MXU spectra, we are using a star which was observed in MOS mode to flux-calibrate the spectra. For chip1, everything is OK, but chip 2 fails. Why?
Answer: In the MOS observations on the standard star, the standard is located on chip 1. Therefore, the chip 1 data has to be used to determine the spectral response function for both chips, so you will have to use the chip 1 data for input, even when reducing the chip 2 data.
- Why are my spectra not flux calibrated, even though there are standard star observations in the data set?
Answer: If there is no reference table for the flux standard star no response curve is created and therefore the science data are not flux-calibrated. The available reference tables can be found in the calibration directory (install_dir/calib/fors-versionnumber/cal).
- Although I am experimenting with different flux standard stars for my observation the flux calibrated spectra do not change. Why?
Answer: If your dataset contains a master response curve (MASTER_SPECPHOT_TABLE) the pipeline will use that one instead of the response curves derived from individual standard stars. In order to see the effect of the different standard stars you have to remove the master response curve from the input data pool.
- There is no master response curve in my datasets - why?
Answer: There are currently no master response curves for the grisms GRIS_1200g, GRIS_200I+OG590, GRIS_600I+OG590, GRIS_600R+GG435, GRIS_600V+GG435, nor for any spectra observed before January 1, 2015. There are also no master response curves for data observed with the blue-sensitive EEV detector.
Spectroscopy - Sky Subtraction and Spectra Extraction
- How does the pipeline choose where on the slit to extract the spectrum in long-slit mode?
Answer: The FORS2 data reduction pipeline extracts a spectrum for each object it detects within the long slit. The object detection is performed on the rectified image if a GLOBAL_DISTORTION_TABLE is provided, otherwise the spatial distortion is not corrected. For non-rectified long slit data broader peaks might appear due to the remaining curvature. The detection algorithm applied is based on the relative peak intensity of each detected object. First of all, a collapsed image is created averaging along the dispersion axis. On this 1-d spatial profile peaks are identified. A peak is identified by a positive value that is preceded and followed by two lower positive values that decrease with distance. For further details, especially concerning the handling of overlapping spectra, please consult the FORS pipeline manual (subsection "Object detection in spectroscopy" in the "Algorithms" section).
- In reducing data from my MXU mask with overlapping spectra, slit tracing fails for a number of slitlets. What do I do?
Answer: In such cases, it may help to run the fors_calib recipe with modified parameters. Changing the parameters cdegree and cmode from their default values (especially setting cmode to 2) should enable a better detection of the edges of not well separated spectra. Varying the cdegree and cmode parameters and comparing the extracted spectra with the ones expected for a "good" (i.e. non-overlapping) slit until a good match is found may be the best way to extract such spectra. However, ultimately, it may not always be possible to extract overlapping MXU spectra in an automated fashion (which is why this is strongly discouraged in MXU mask design).
- My target is faint and is not detected by the automatic detection algorithm for objects within the slit included in the pipeline. How can I change the detection threshold in the pipeline?
Answer: Unfortunately there is currently no option in the pipeline to set the detection threshold for objects within the slit(s). So currently the only solution would be to use the 2D rectified spectrum produced by the pipeline and do the spectral extraction with some other software (e.g. iraf).
- The sky subtraction of my long slit spectra seems to be poor. What can I do?
Answer: You can try to use --skyglobal=TRUE --skylocal=FALSE instead of the default. It may also be helpful to keep the spatial gradient in the master flat field by setting --sradius=-1 in fors_calib.
- I prefer to subtract the sky with external routines (i.e. in the case of extended objects that cover most of the slit(s), or dedicated sky observations). What are the relevant files I should use for this purpose?
Answer: The fors_science product MAPPED_ALL_SCI_<MODE> (MODE = LSS, MOS, MXU) contains the rectified and wavelength calibrated image (not flux calibrated). External routines for sky subtraction can be applied to this file.
After the sky subtraction the SPECPHOT_TABLE from the processing of the flux standard star can be used to perform the flux calibration. The relevant columns in the table are WAVE and RESPONSE (RESPONSE_FFSED for volume phase holographic grisms), which can be used to apply the response curve and obtain the desired sky-subtracted and flux-calibrated spectrum. For volume phase holographic grisms you will also need the spectral energy distribution of the flat field (FLAT_SED_<MODE> (MODE = LSS, MOS, MXU), provided by fors_calib). The correction for atmospheric dispersion and gain has to be performed independently as well.
- I see a systematic offset in the coordinates determined for my extracted spectra with respect to the known coordinates of my objects - why?
Answer: This shift can be due to 3 effects:
• The limited accuracy of the VLT pointing and guide star coordinates. This can on average be about 2-3 arcsec and at maximum about 5 arcsec.
• The pipeline uses the undeviated wavelength of the grism (stored in the keyword HIERARCH ESO INS GRIS1 WLEN) to determine the position of the object for a given extracted spectrum. We found that the original values are not accurate for some grisms. For data taken since April 5, 2017, the header values should be correct. The older data are being updated but due to the data volume this will take some time. The new values are listed below. If you change the header values to the new ones your WCS should improve.
INS.GRIS1.NAME. | INS.GRIS1.ID | INS.OPTI7.NAME | INS.GRIS1.WLEN | comment |
GRIS_1200B | +97 | free | 436. | |
GRIS_1200g | +96 | free | 486. | |
GRIS_1200R | +93 | GG435 | 653. | |
GRIS_1400V | +18 | free | 520.3 | |
GRIS_150I | +27 | [all] | 716.9 | |
GRIS_200I | +28 | free | 743.2 | |
GRIS_300V | +20 | [all] | 585.4 | until 2009-03-03 |
GRIS_300V | +10 | [all] | 584.9 | since 2009-03-04 |
GRIS_300I | +21 | [all] | 857.3 | until 2009-03-03 |
GRIS_300I | +11 | [all] | 857.5 | since 2009-03-04 |
GRIS_600B | +22 | free | 462.7 | |
GRIS_600V | +94 | GG435 | 581. | |
GRIS_600R | +14 | GG435 | 627.7 | |
GRIS_600RI | +19 | GG435 | 677.7 | |
GRIS_600I | +25 | OG590 | 793.5 | |
GRIS_600z | +23 | OG590 | 892.7 |
- The wavelength calibration is not accurate enough. As stated above the pipeline uses the wavelength recorded in HIERARCH ESO INS GRIS1 WLEN to calculate the coordinates for an extracted spectrum. If the wavelength calibration is not good this will introduce an offset.
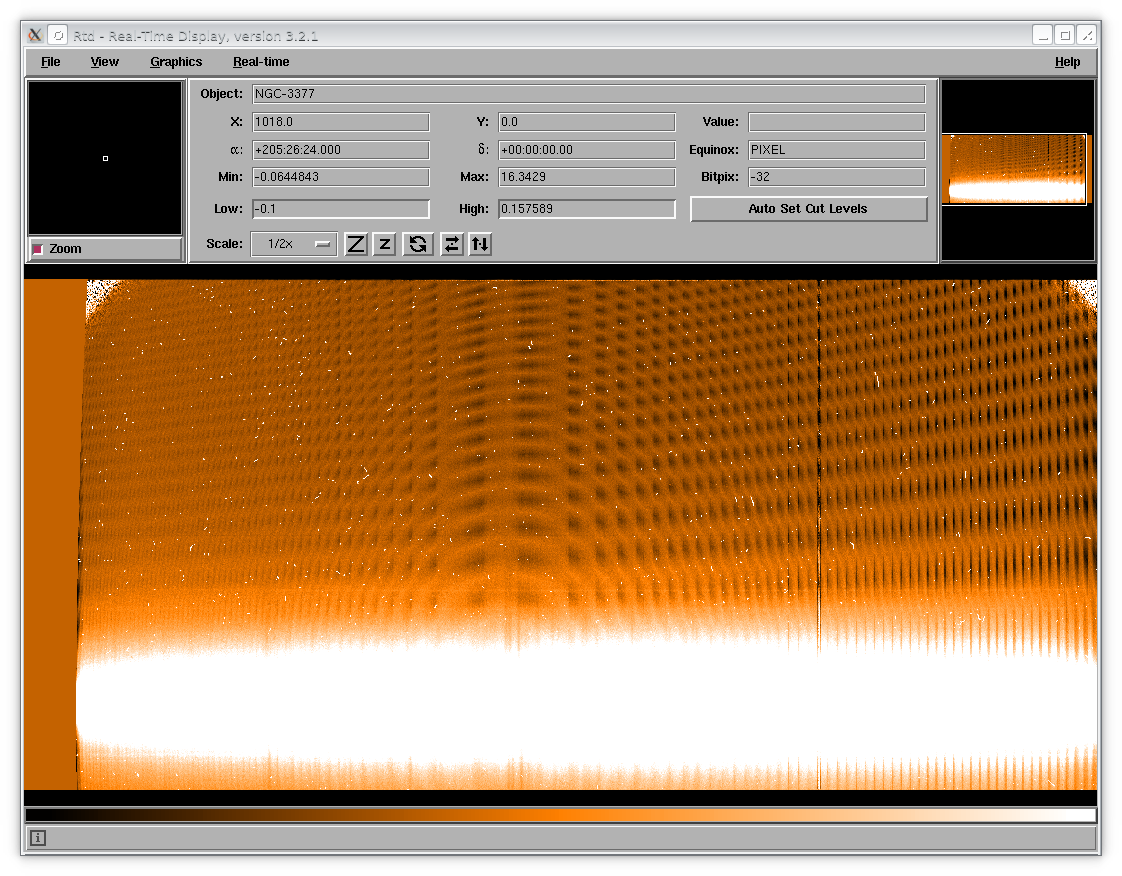
- I see problems in the sky subtraction of my LSS observations of bright extended objects or multiple bright point sources - why?
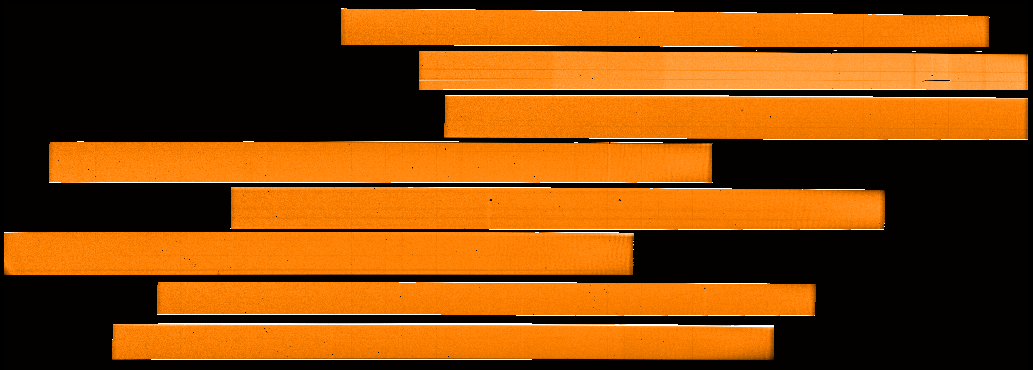
Answer: For LSS data with a bright extended object or several bright point sources close to each other, the sky subtraction method skyglobal of the fors_science recipe creates an interference like pattern in the fitted sky, probably caused by non-flat sky background, as you can see in the next pictures for point sources (top panel) and extended sources (bottom panel).
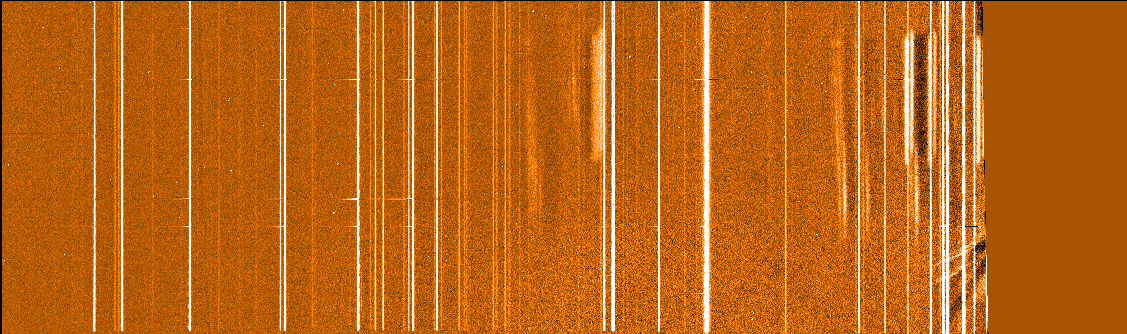
This pattern is then also visible in reverse in the sky-subtracted data (see top panel for the point sources and the bottom panel for the extended ones in the figure below).
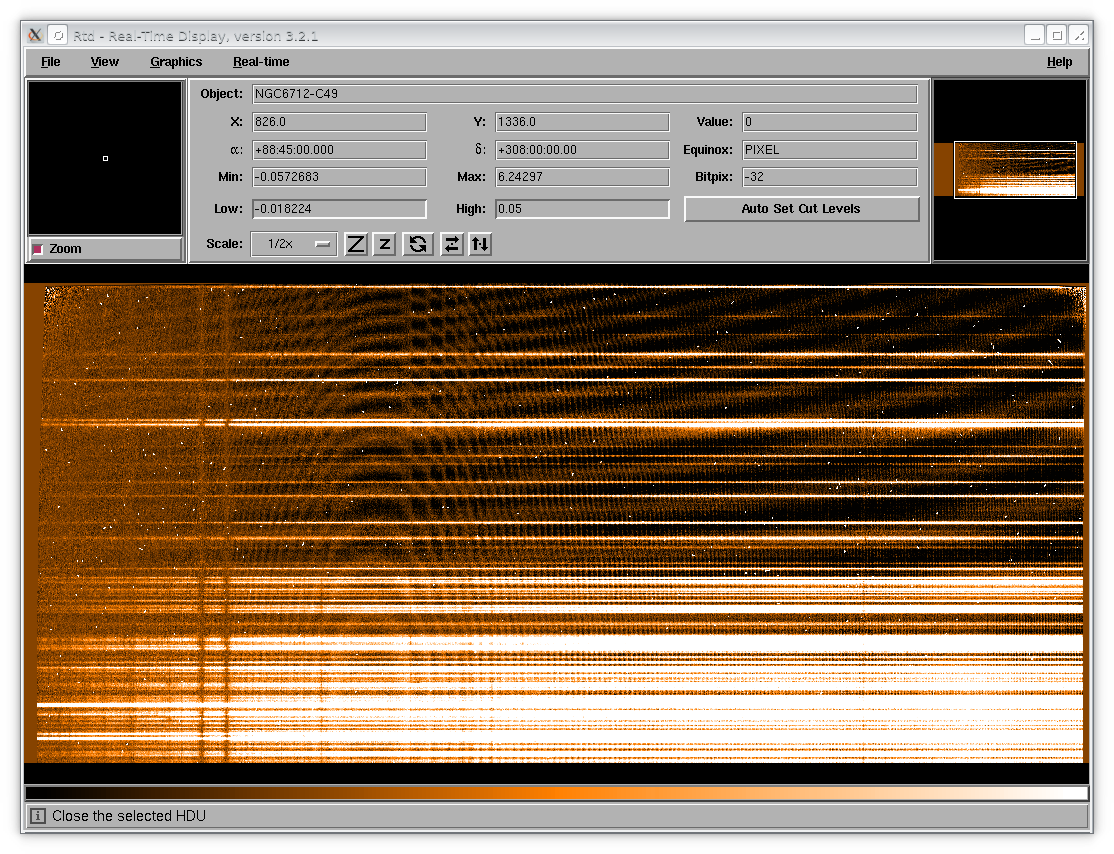
Therefore, the option skymedian is used instead to process LSS data, as shown below . This sky subtraction uses the median of the signal of all pixels in a wavelength bin of the rectified frame as sky signal for that wavelength bin.
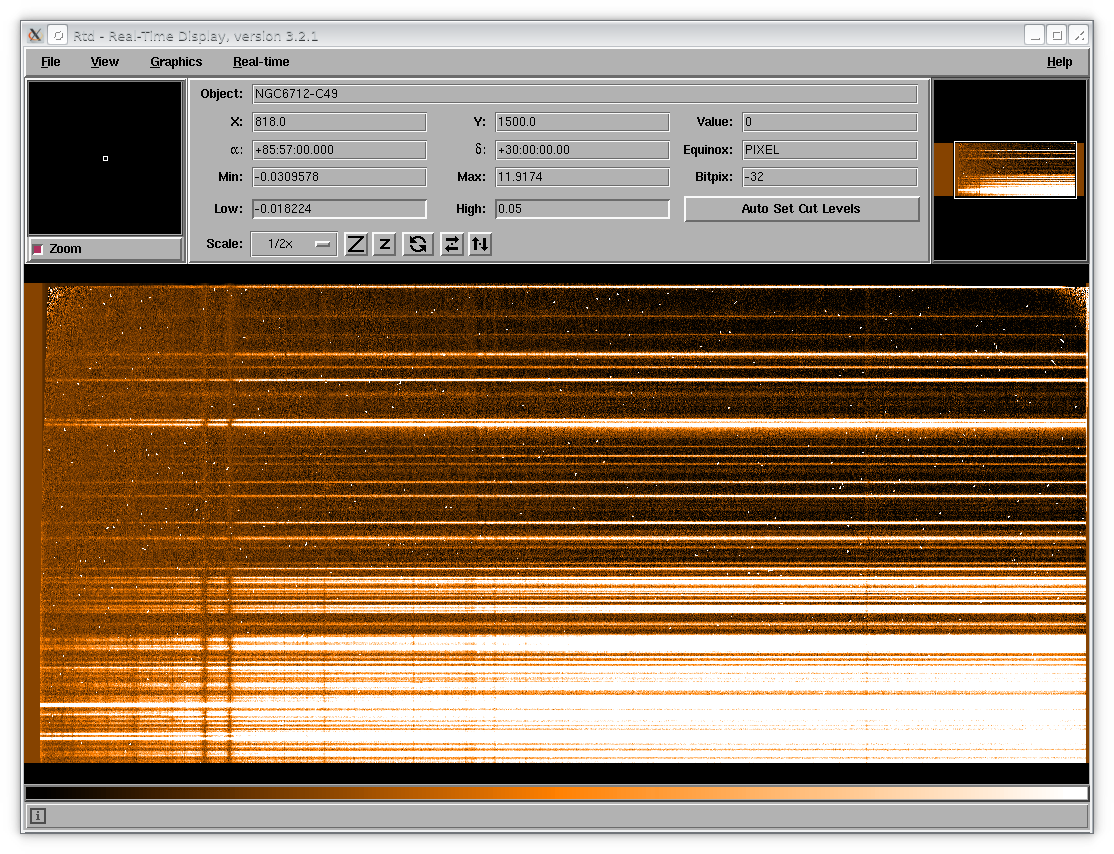
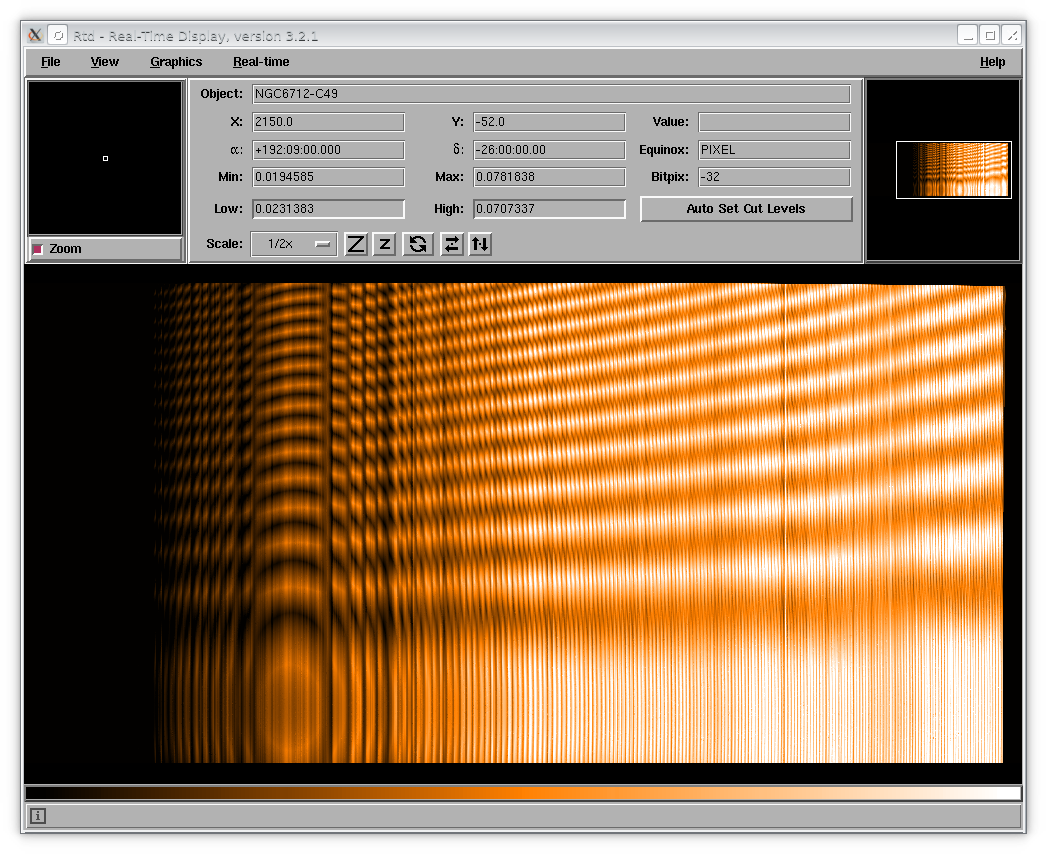
- Some of the slitlets in my science data look badly traced. Why?
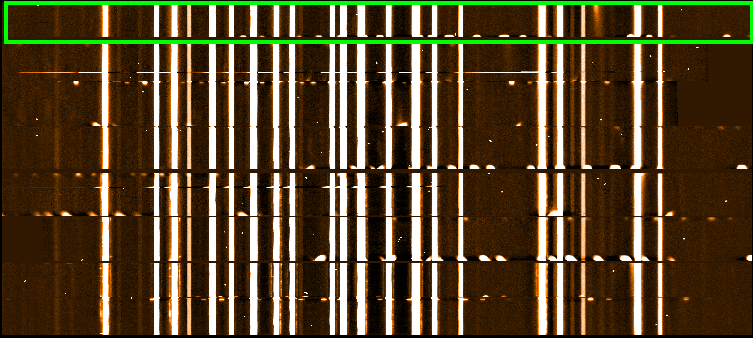
Answer: This is most likely caused by an imperfect tracing of the slitlets in the calibration data. Usually an incompletely traced slit can well be seen in normalized master flat field. An example for badly traced is shown below (TPL.START=2022-04-02T10:56:46):
Because the pipeline detects the slit edges first in the arc lamp frame a probable culprit is the peakdetection recipe parameter of the fors_calib recipe, which may be too low or too high. Below we show the raw arc lamp frame for the calibrations, where the affected slit is marked in green:
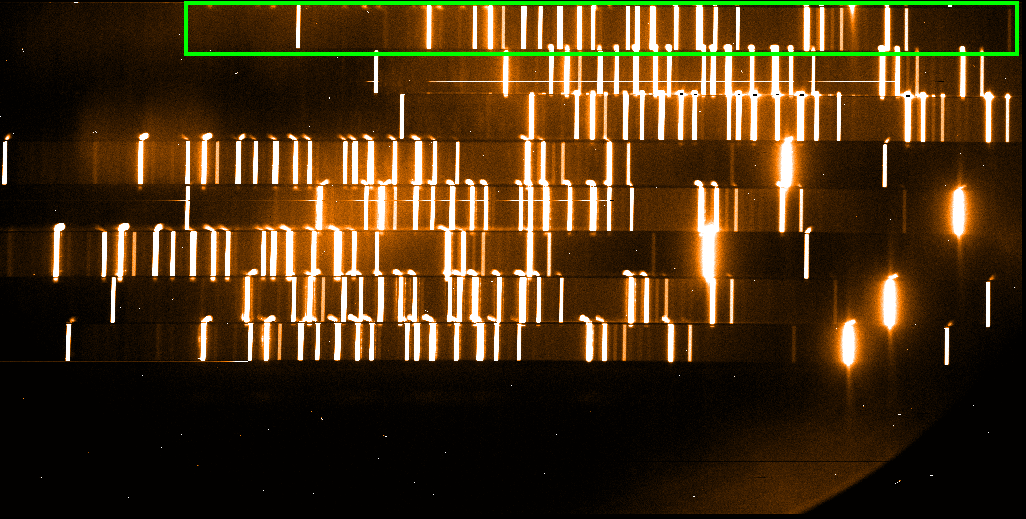
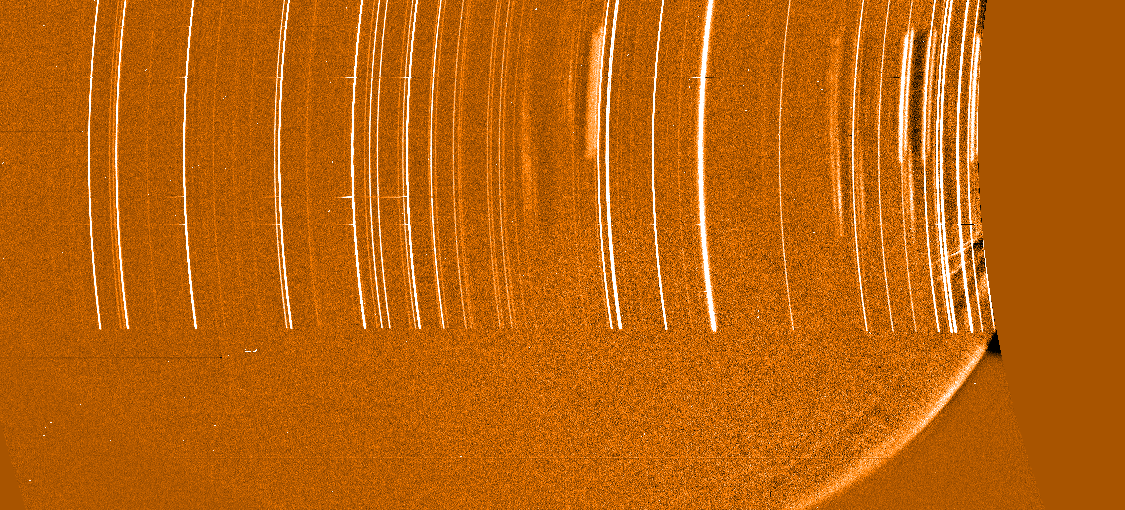
The wavelength calibrated arc lamp frame shows that the topmost slitlet has not been properly detected - it includes lines from the slitlet below:
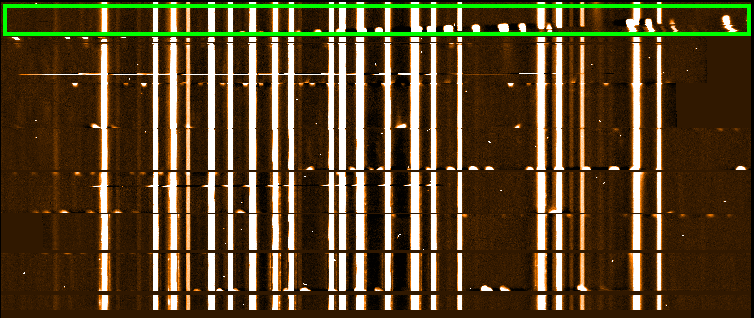
Reducing the peak detection parameter from 300 to 250 allows the pipeline to correctly trace the topmost slitlet:
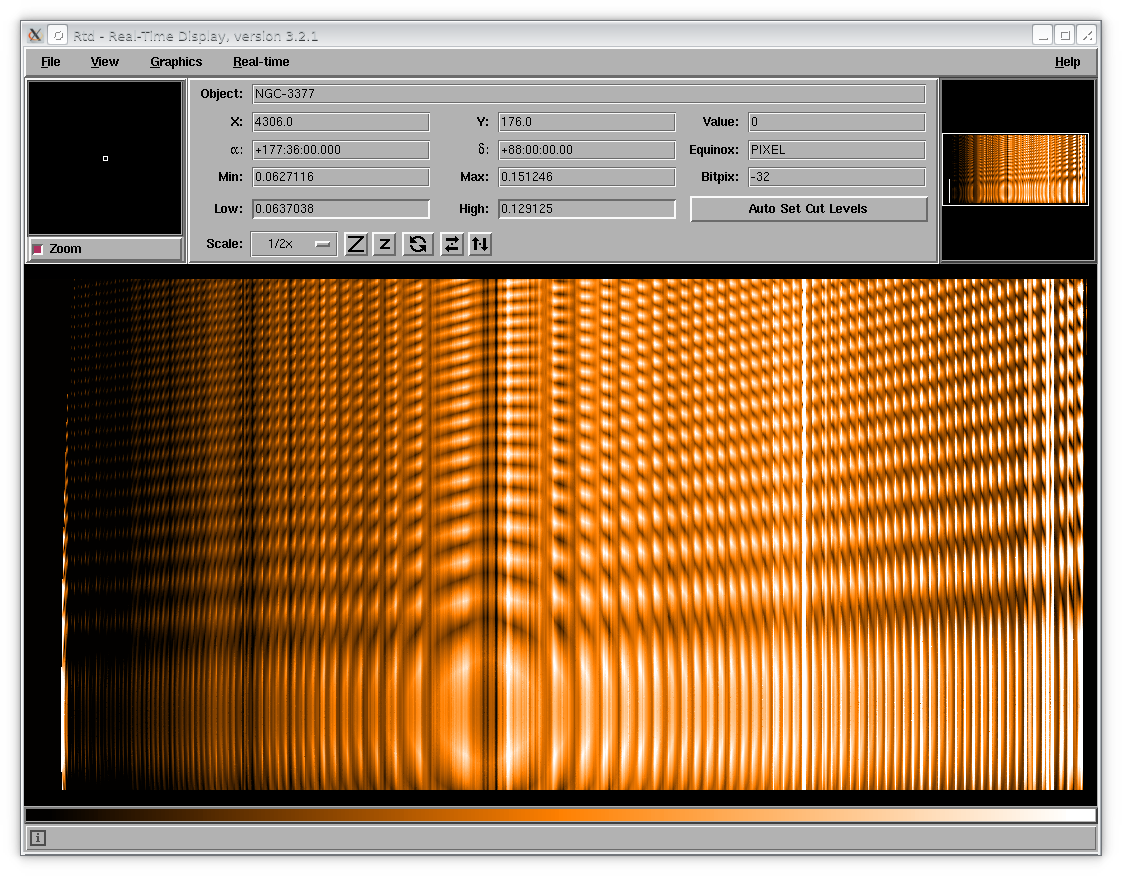
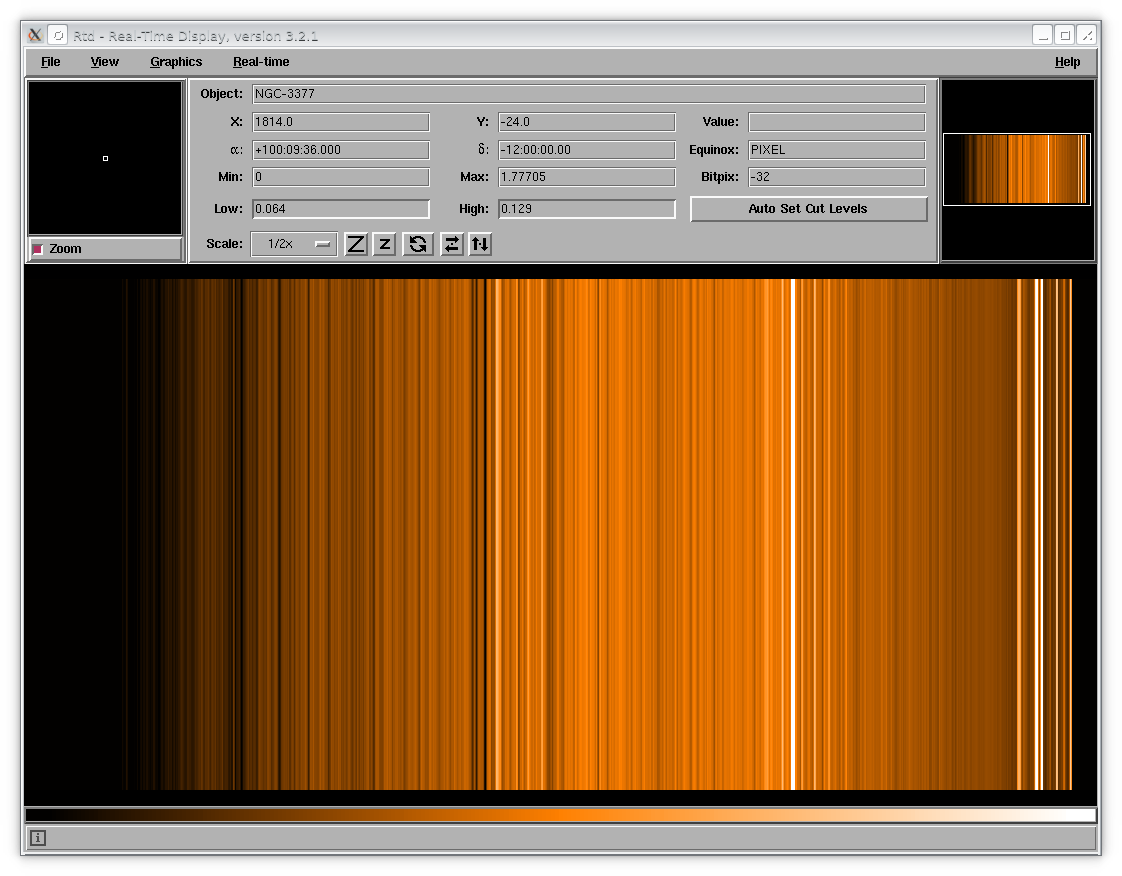
- My long-slit spectra show curved sky lines. Why?
Answer: This is caused by a bad wavelength calibration. Most likely the recipe parameter peakdetection in the fors_calib recipe was set too low. Below we show an extreme examples for the arc lamp frame FORS2.2022-04-07T15:38:16.642. With the default values of 60 for peakdetection the pipeline does not detect the lower boundary of the long slit and instead tries to fit spurious detections of arc lamp lines.
If one uses instead a value of 80 the data are well calibrated.
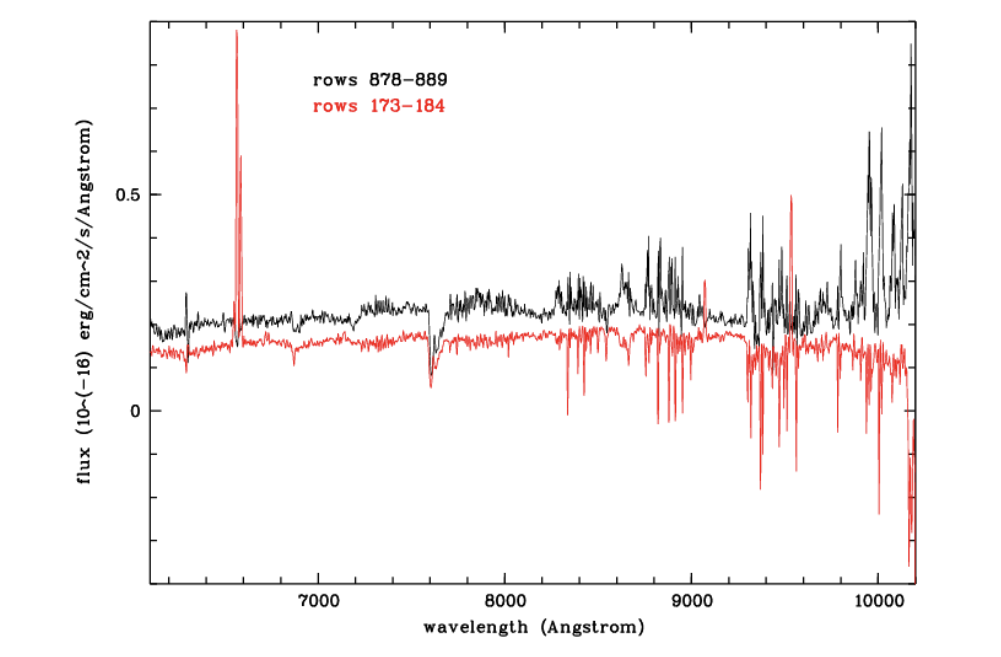
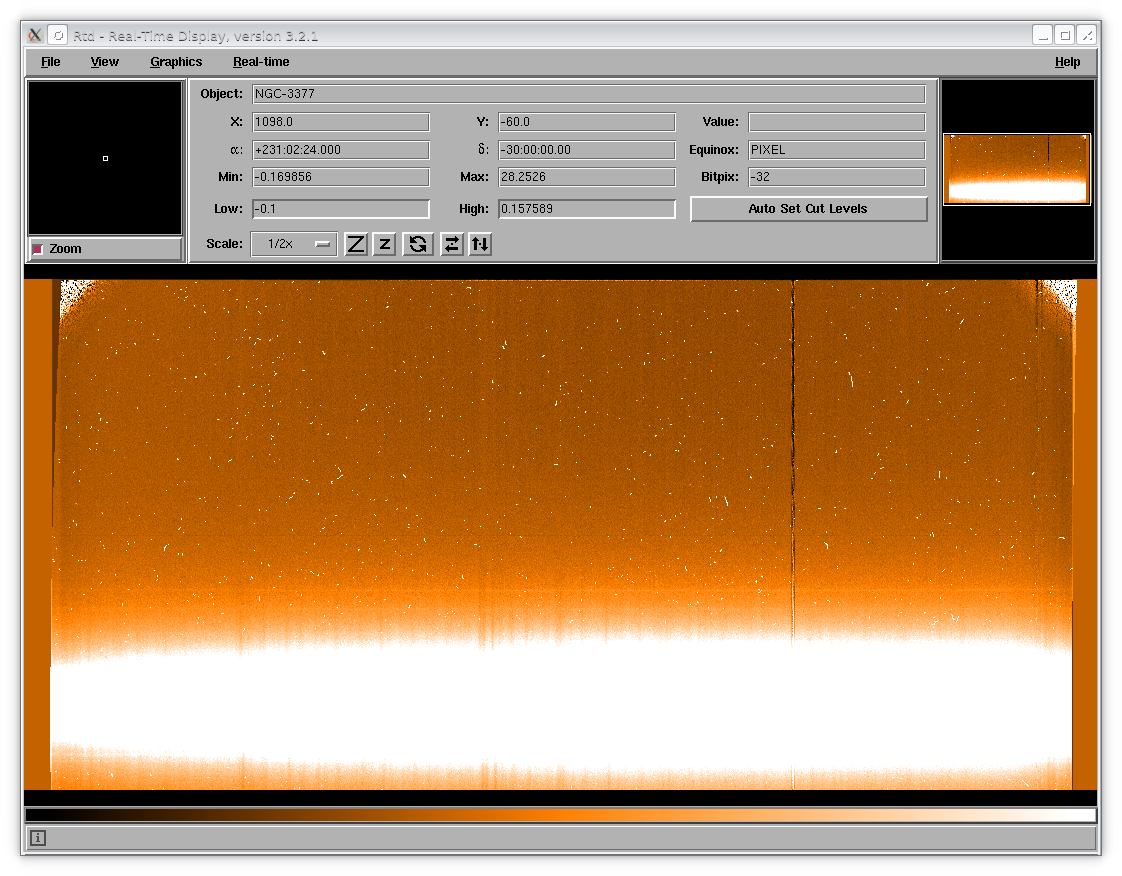
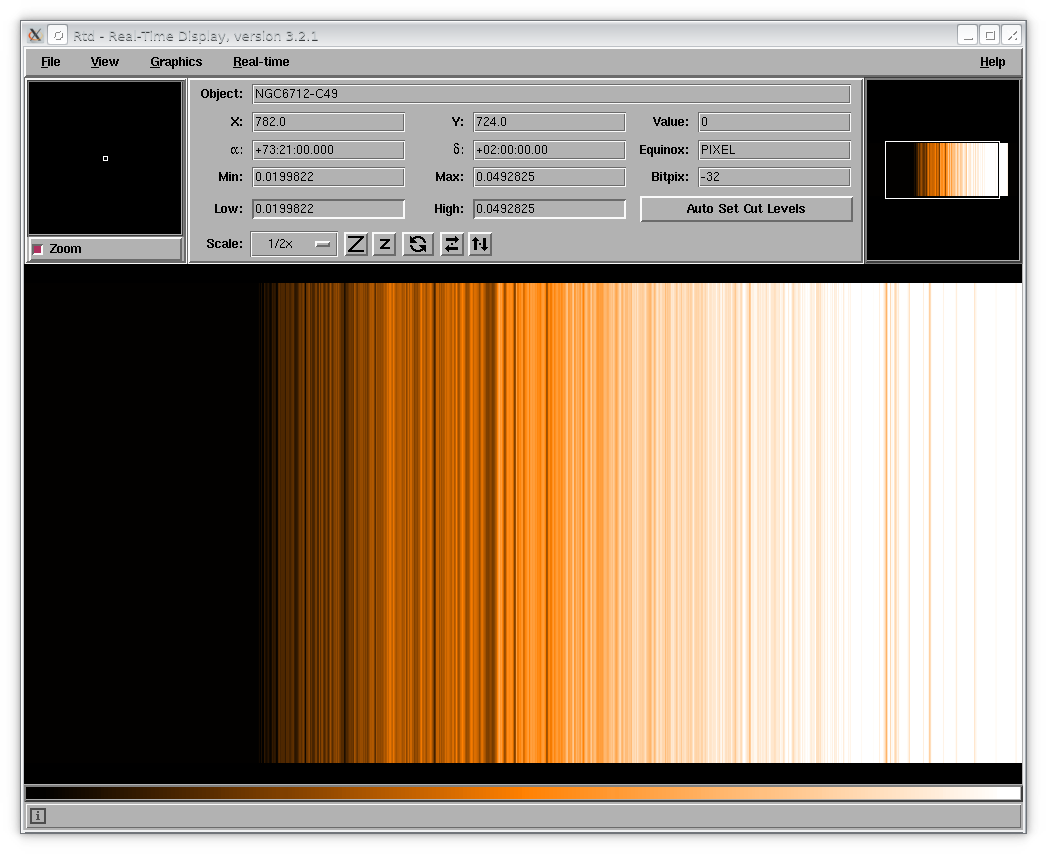
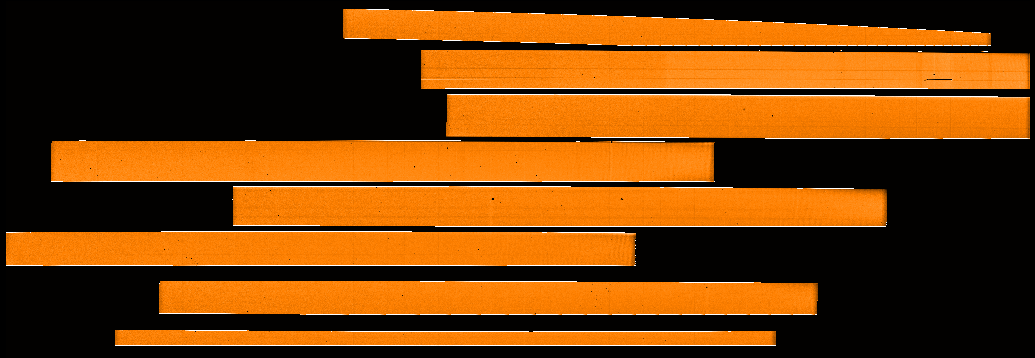
- The sky background in my long-slit data show a gradient along the slit after the sky subtraction. Why?
Answer: The two sky subtraction methods available for long-slit FORS2 spectra (skymedian and skyglobal) rely on a flat distribution of the sky background along the slit. If there is a spatial gradient in the sky background the actual sky background will be higher or lower than the fitted one. This can be seen in the example shown below:
The screen shot above shows the rectified, wavelength calibrated pipeline product for the raw file FORS2.2009-04-28T08:36:27.441 (GRIS_300I+OG590 observation of V4334 Sgr). The screen shot below shows the frame after the sky subtraction. One can clearly see that too much skylight has been subtracted in the lower part (dark sky lines) and too little in the upper part (bright sky lines). Please note that the dynamic range of the image above is 10 times larger than that of the image below.
Below we show two spectra extracted from the sky subtracted frame above, from the upper part (too little sky subtracted, sky lines in emission) and from the lower part (too much sky subtracted, sky lines in absorption). While the effect is obvious for these faint spectra it will be more subtle for bright targets.