


Data processing of UVES data: Frequently asked questions
Where can I find the science-ready data products available for UVES, and more information about their processing?
Answer: The UVES data can be queried under
http://archive.eso.org/wdb/wdb/adp/phase3_spectral/form?collection_name=UVES.
The Release Description, with information on the processing and on known limitations, comes with the downloaded data and can also be found at http://www.eso.org/qc/PHOENIX/UVES_ECH/processing.html.
What is the best way to reduce UVES data?
Answer: Reduced data can be obtained directly from the ESO archive.
For customized or optimized data reduction, we recommend to run the ESO pipeline with a reflex workflow. Pipelines and tutorials how to reduce the data are available at http://www.eso.org/sci/software/pipelines/.
Is there a way to generate a calibrated 2D spectrum with the pipeline?
Answer: Setting reduce.extract.method = 2d in the uves_obs_scired recipe will create a 2D rectified and merged spectrum. In Reflex, you can do this by right-clicking on the "Spectrum Extraction" actor, selecting Configure Actor, and changing the INIT_REDUCE_EXTRACT_METHOD to 2d and EnableInteractivity to false. In addition, you have to configure the RecipeExecuter for uves_obs_scired as follows: Right-click on the "Spectrum Extraction" actor and select Open Actor, then right-click on the uves_obs_scired actor and select Configure Actor. In the pop-up window delete the entries in the "Output Files Category" and then click on "Commit".
Please note that if you want one- and two-dimensional spectra, you have to process the data twice with different values for reduce.extract.method.
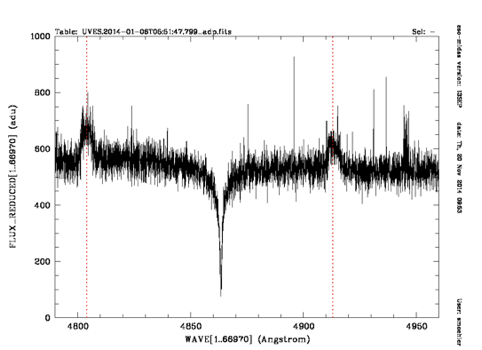
I see unexpected boxy emission-like features in my REDL spectra - where do they come from?
Answer: The pipeline by default interpolates across the bad columns in the REDL CCD when it creates the master bias, but does not so when it processes the science data. This inconsistency can create boxy emission-like features as seen in the figure below. You can get rid of them by re-processing your data using --clean_trap=FALSE also for the bias recipe. Below you find a list of wavelength ranges where the features can be seen in the standard REDL settings:
520nm 4230Å-4260Å
580nm 4790Å-4950Å
760nm 5720Å-5860Å
860nm 6800Å-7050Å
I have a standard star in my DataSet but it is not found in the standard star catalog. Why?
Answer: Most likely you have one of the old UVES standard stars, for which no fine sampled high resolution reference data exist. If you have to use this specific star you can find the catalog and a table with fit points at: ftp://ftp.eso.org/pub/dfs/pipelines/instruments/uves/uves_response_old_calib.tar.gz.
Please be aware that these data are not well suited for the response determination (see next question for details).
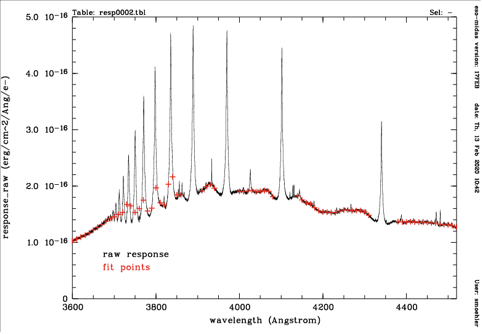
The response curve derived from my standard star looks very bad and the raw response shows huge residuals. Why?
Answer: The pipeline supports seven standard stars, for which high-resolution reference data based on model spectra exists: EG 21, EG 274, Feige 110, GD 71, GD 153, LTT 3218, and LTT 7987. For other standard stars observed with UVES the reference data were mostly derived from low-resolution observations and are sampled at coarse intervals (typically 50 Angstrom).
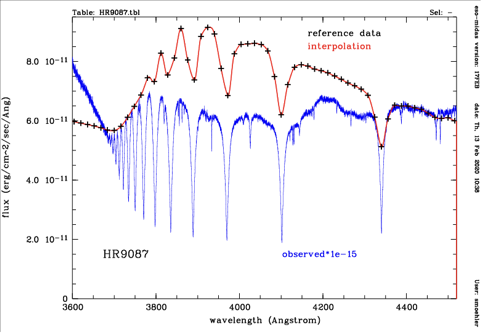
The figure below shows an example for the standard star HR 9087 observed with the 390 setup. The left plot shows the ratio of the observed spectrum and the interpolated reference data (black) and the points used to fit the response (red). These fit points were optimized for the new high-resolution reference data, which yield raw response curves with small residuals at line cores only. Obviously they are not suitable for this observation. The right plot illustrates this problem by showing in black the reference data, in red the interpolated reference spectrum and in blue the observed spectrum, scaled to fit into the plot. The observed lines are obviously much better resolved than the reference data. So even if the fit points were revised the response curve will not be good. If you absolutely need to use such a standard star you have to refine the fit points by editing the corresponding entry in the static calibration file RESP_FIT_POINTS_CATALOG found at: ftp://ftp.eso.org/pub/dfs/pipelines/instruments/uves/uves_response_old_calib.tar.gz.
I activated the "Use CalSelector Associations" option in the DataOrganizer. Now I get an error even though the Datasets were marked as complete. Why?
Answer: This happens when the OCA rules to define the Datasets differ between Reflex and calSelector. We are currently working to homogenize the two tools and sets of rules. Until this has been achieved we recommend not to use this option in the DataOrganizer.